
A candlestick pattern is a specific form of the candlestick on a stock chart that is used to predict future price movements. Candlesticks are a type of chart used in technical analysis to display a security's high, low, open, and close prices over a specific period. There are many candlestick patterns, each with unique characteristics and potential signals. Some common examples include the bullish and bearish engulfing patterns, the hammer and hanging man patterns, and the bullish and bearish harami patterns.
There are many different types of candlestick patterns. Some of the most commonly used patterns include:
-
Bullish patterns:
- Bullish Engulfing
- Hammer
- Piercing Line
- Bullish Harami
-
Bearish patterns:
- Bearish Engulfing
- Hanging Man
- Dark Cloud Cover
- Bearish Harami
-
Reversal patterns:
- Doji
- Morning Star
- Evening Star
- Abandoned Baby
Bullish patterns:
Bullish Engulfing
The Bullish Engulfing pattern is a bullish reversal pattern that occurs when a small bearish candle is followed by a larger bullish candle that completely "engulfs" the previous candle. This pattern suggests that the bears were in control during the first candle, but the bulls have taken control during the second candle and are pushing the price higher. This can be a strong signal that the trend is reversing from bearish to bullish.
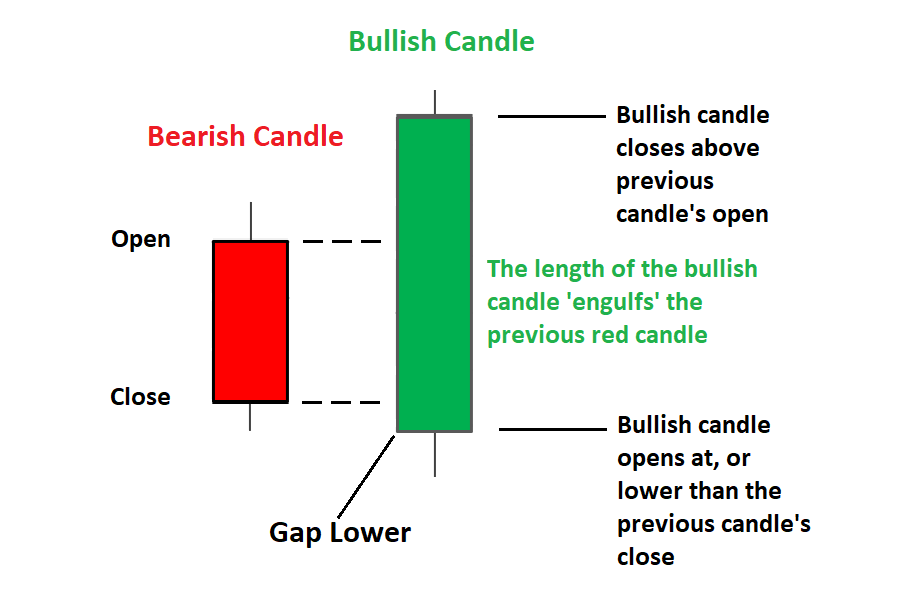
It's important to note that the Bullish Engulfing pattern is more significant if it appears after a downtrend, and it's more reliable if it's followed by an increase in volume.
The Bullish Engulfing pattern is a strong signal that the bears have lost control and the bulls are taking over, and it's a good indication that the price will continue to rise.
Hammer
The Hammer pattern is a bullish reversal pattern that forms at the bottom of a downtrend. It is characterized by a small real body (either black or white) near the top of the candle with a long lower shadow that is at least twice the length of the real body. The upper shadow is typically very small or non-existent. The long lower shadow indicates that the bears pushed the price down significantly during the trading period, but the bulls stepped in and pushed the price back up close to the open by the end of the period.
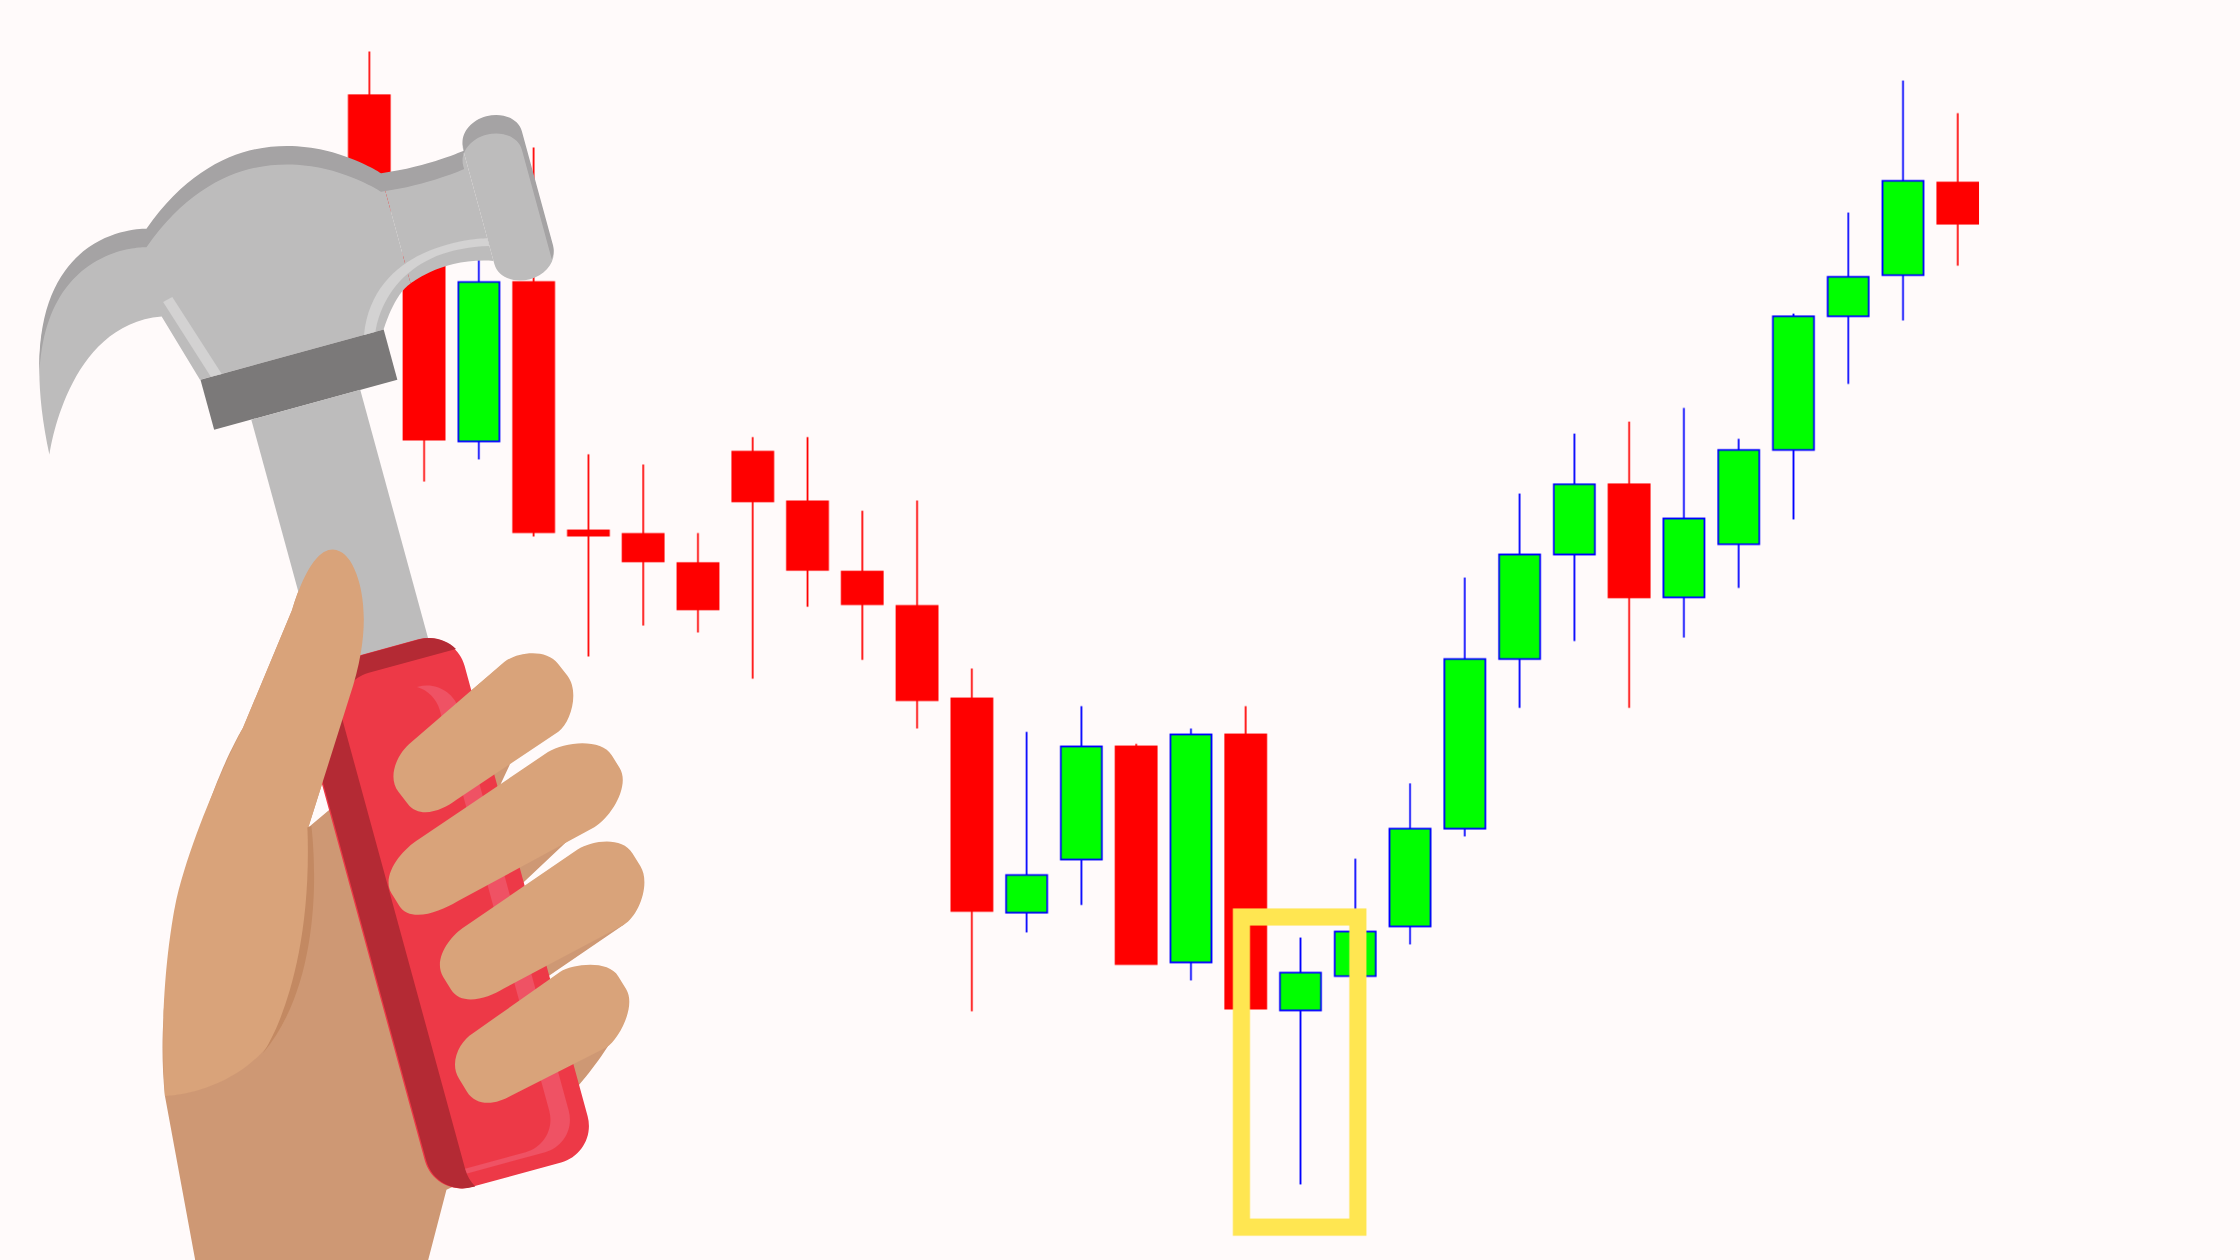
The Hammer pattern is considered a bullish reversal pattern because it suggests that the bears are losing control and the bulls are starting to take control. It's more reliable if it appears after a significant downtrend, and it's more significant if it's followed by an increase in volume.
It's worth noting that the Hammer pattern is similar to the Hanging Man pattern, which is a bearish reversal pattern that forms at the top of an uptrend. The main difference is that the Hanging Man pattern appears at the top of an uptrend and the Hammer pattern appears at the bottom of a downtrend.
Piercing Line
The Piercing Line pattern is a bullish reversal pattern that occurs when a long bearish candle is followed by a bullish candle that "pierces" the midpoint of the previous candle. The bullish candle should open below the close of the previous bearish candle and close above its midpoint.
This pattern is considered a bullish reversal pattern because it suggests that the bears are losing control and the bulls are starting to take control. It's a signal that the trend is reversing from bearish to bullish, and it's more significant if it's followed by an increase in volume.
It's worth noting that the Piercing Line pattern is similar to the Dark Cloud Cover pattern, which is a bearish reversal pattern that occurs when a long bullish candle is followed by a bearish candle that "covers" the midpoint of the previous candle. The bearish candle should open above the close of the previous bullish candle and close below its midpoint.
As with any technical analysis, it's important to consider the Piercing Line pattern in the context of the overall trend and in conjunction with other indicators, before making any trades.
Bullish Harami
The Bullish Harami pattern is a bullish reversal pattern that occurs when a large bearish candle is followed by a smaller bullish candle that is "contained" within the range of the previous candle. This pattern suggests that the bears were in control during the first candle, but the bulls may be starting to take control during the second candle.
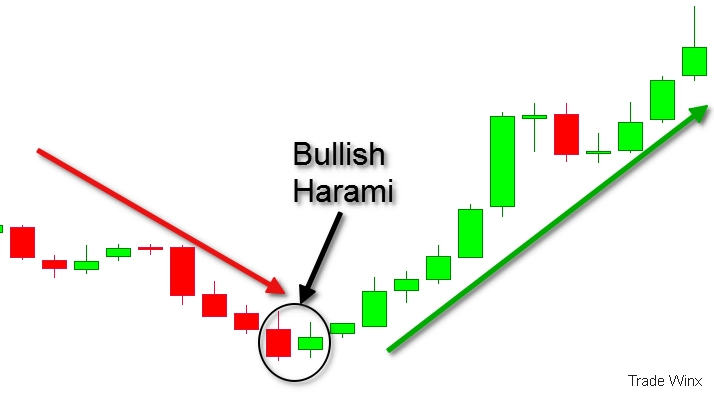
It's considered a relatively weak signal compared to other reversal patterns, but it's more significant if it appears after a downtrend, and it's more reliable if it's followed by an increase in volume.
It's worth noting that the Bullish Harami pattern is similar to the Bearish Harami pattern, which is a bearish reversal pattern that occurs when a large bullish candle is followed by a smaller bearish candle that is "contained" within the range of the previous candle. This pattern suggests that the bulls were in control during the first candle, but the bears may be starting to take control during the second candle.
As with any technical analysis, it's important to consider the Bullish Harami pattern in the context of the overall trend and in conjunction with other indicators, before making any trades.
Bearish patterns:
Bearish Engulfing
The Bearish Engulfing pattern is a bearish reversal pattern that occurs when a small bullish candle is followed by a larger bearish candle that completely "engulfs" the previous candle. This pattern suggests that the bulls were in control during the first candle, but the bears have taken control during the second candle and are pushing the price lower. This can be a strong signal that the trend is reversing from bullish to bearish.
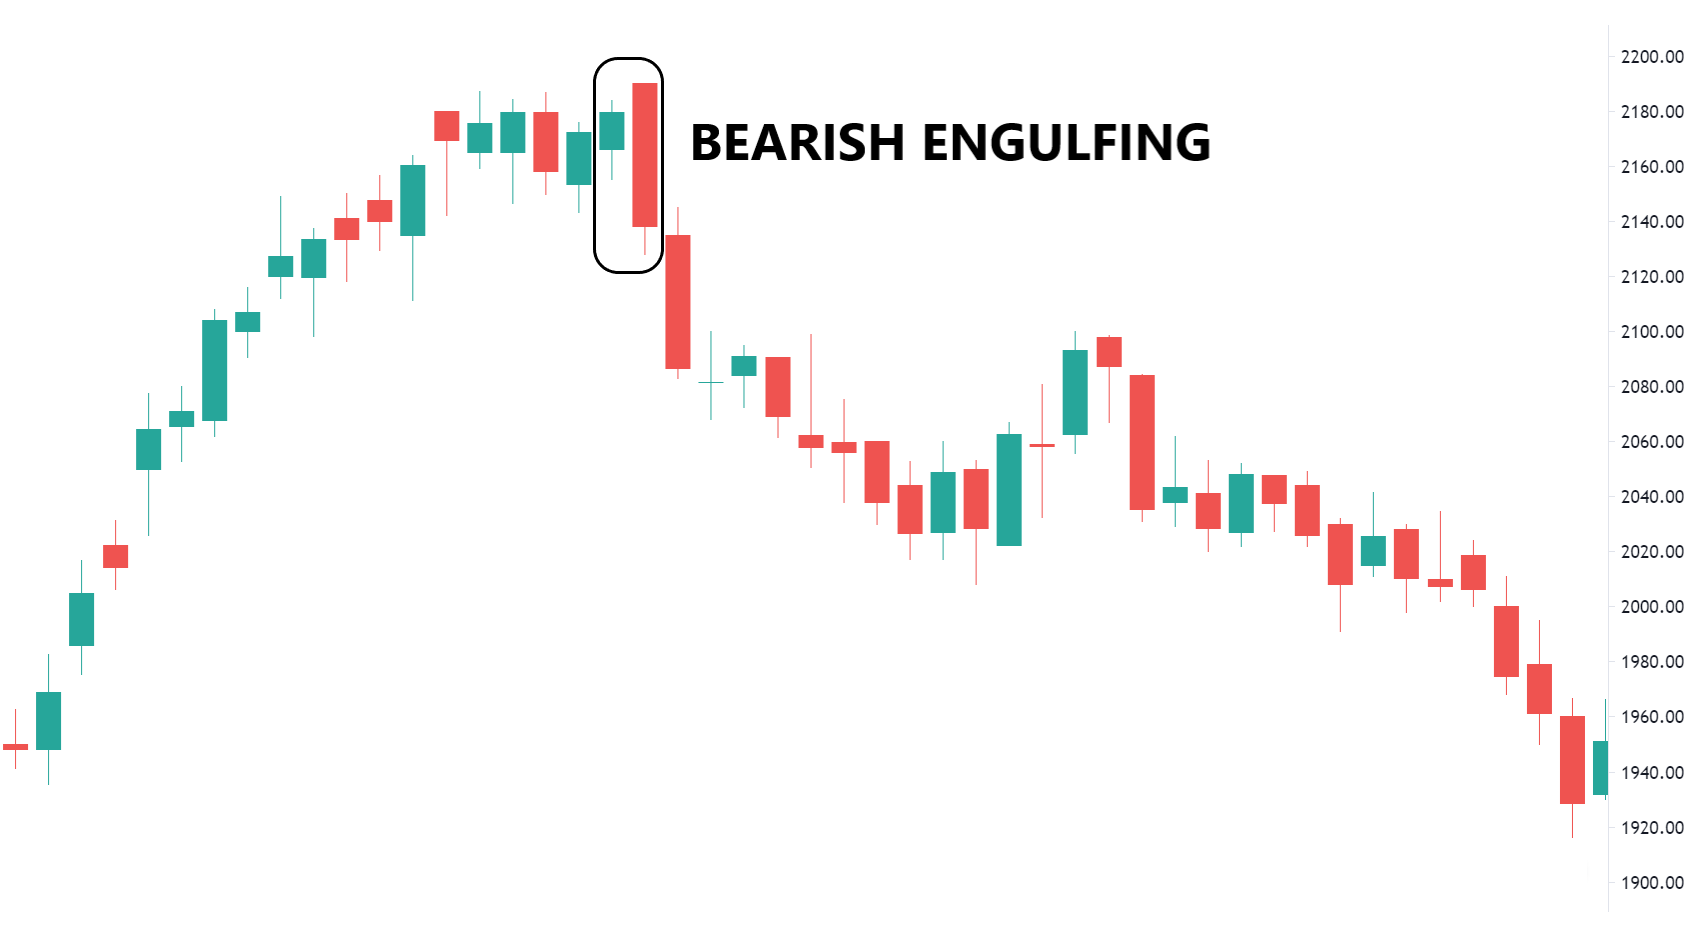
It's important to note that the Bearish Engulfing pattern is more significant if it appears after an uptrend, and it's more reliable if it's followed by an increase in volume.
The Bearish Engulfing pattern is a strong signal that the bulls have lost control and the bears are taking over, and it's a good indication that the price will continue to decrease.
Hanging Man
The Hanging Man pattern is a bearish reversal pattern that forms at the top of an uptrend. It is characterized by a small real body (either black or white) near the bottom of the candle with a long upper shadow that is at least twice the length of the real body. The lower shadow is typically very small or non-existent. The long upper shadow indicates that the bulls pushed the price up significantly during the trading period, but the bears stepped in and pushed the price back down close to the open by the end of the period.
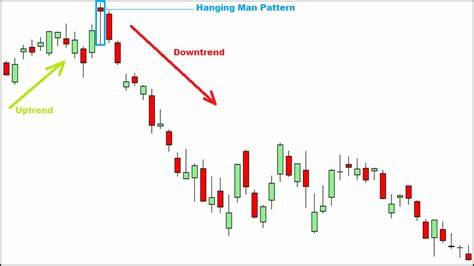
The Hanging Man pattern is considered a bearish reversal pattern because it suggests that the bulls are losing control and the bears are starting to take control. It's more reliable if it appears after a significant uptrend, and it's more significant if it's followed by an increase in volume.
It's worth noting that the Hanging Man pattern is similar to the Hammer pattern, which is a bullish reversal pattern that forms at the bottom of a downtrend. The main difference is that the Hanging Man pattern appears at the top of an uptrend and the Hammer pattern appears at the bottom of a downtrend.
Dark Cloud Cover
The Dark Cloud Cover pattern is a bearish reversal pattern that occurs when a long bullish candle is followed by a bearish candle that "covers" the midpoint of the previous candle. The bearish candle should open above the close of the previous bullish candle and close below its midpoint. This pattern suggests that the bulls were in control during the first candle, but the bears are starting to take control during the second candle and pushing the price lower.
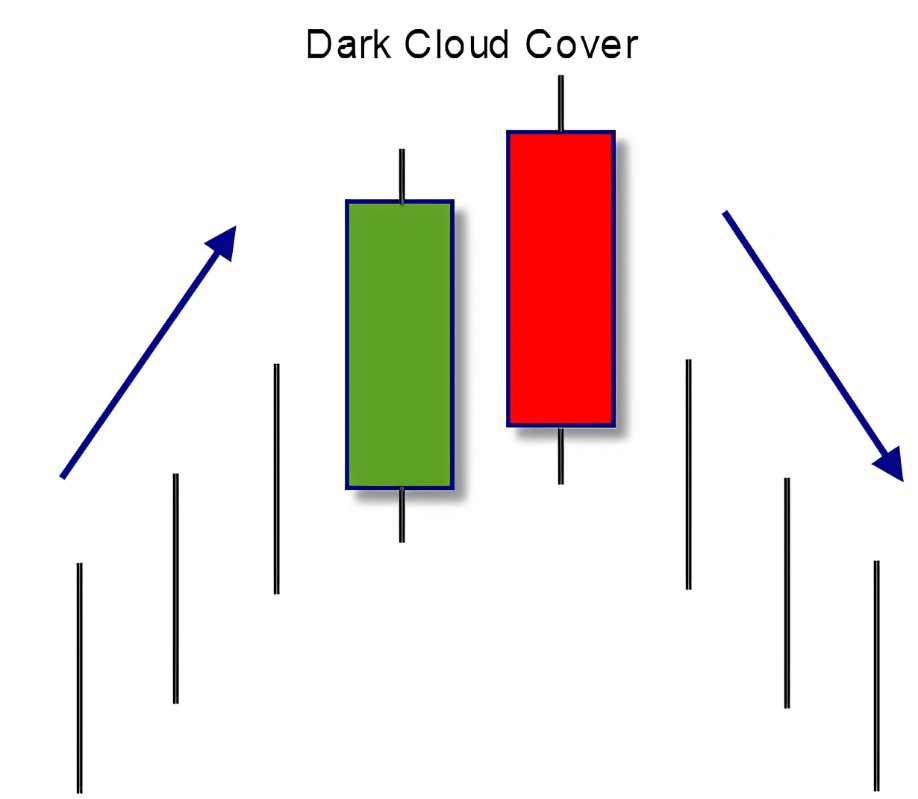
It's considered a bearish reversal pattern because it suggests that the bulls are losing control and the bears are starting to take control. It's more reliable if it appears after a significant uptrend, and it's more significant if it's followed by an increase in volume.
It's worth noting that the Dark Cloud Cover pattern is similar to the Piercing Line pattern, which is a bullish reversal pattern that occurs when a long bearish candle is followed by a bullish candle that "pierces" the midpoint of the previous candle. The bullish candle should open below the close of the previous bearish candle and close above its midpoint.
As with any technical analysis, it's important to consider the Dark Cloud Cover pattern in the context of the overall trend and in conjunction with other indicators, before making any trades.
Bearish Harami
The Bearish Harami is a bearish reversal pattern that occurs when a large bullish candle is followed by a smaller bearish candle that is "contained" within the range of the previous candle. This pattern suggests that the bulls were in control during the first candle, but the bears may be starting to take control during the second candle.
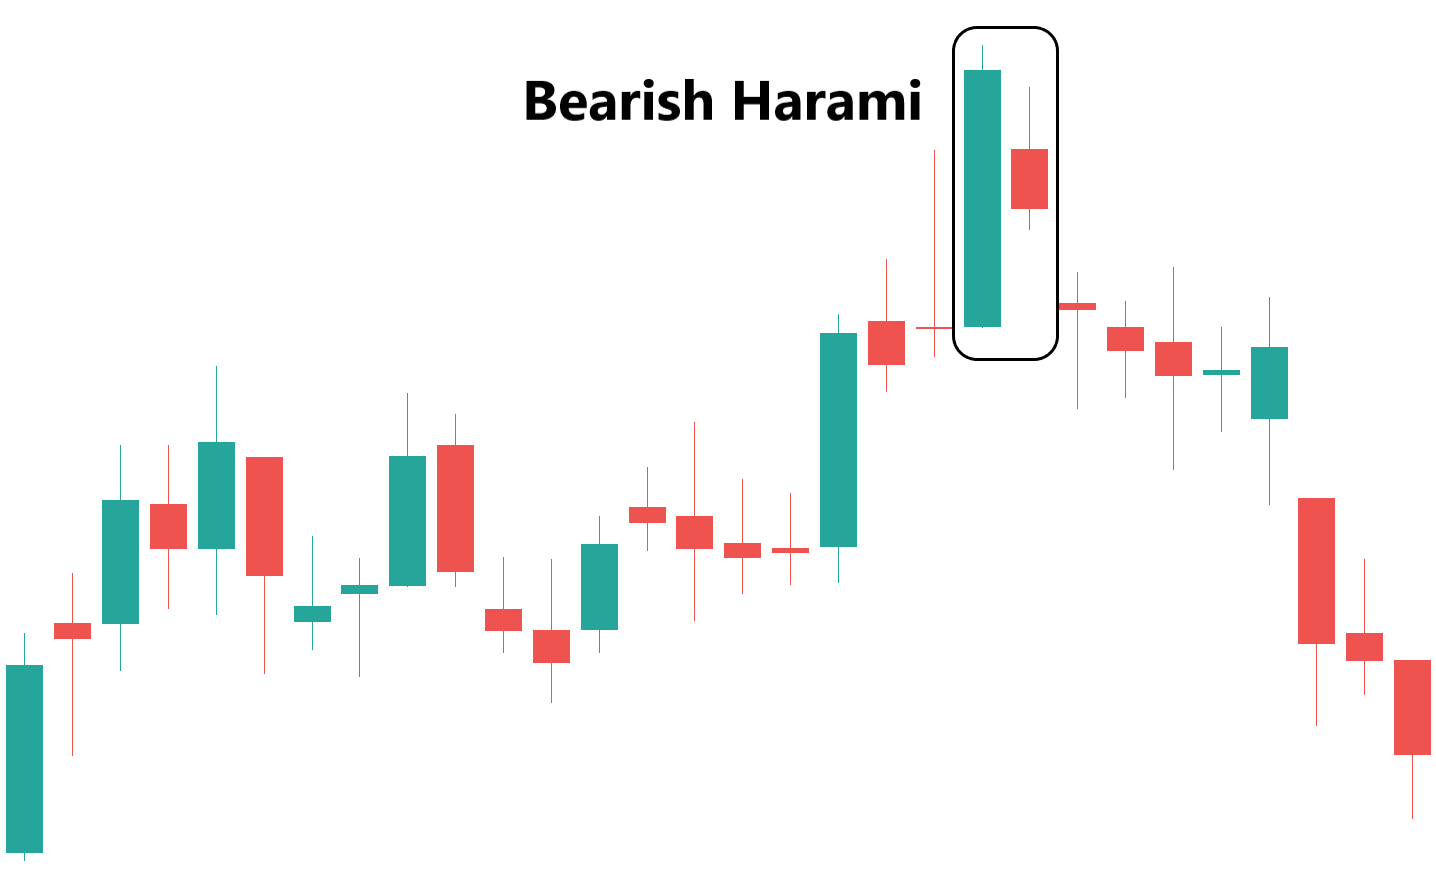
It's considered a relatively weak signal compared to other reversal patterns, but it's more significant if it appears after an uptrend, and it's more reliable if it's followed by an increase in volume.
It's worth noting that the Bearish Harami pattern is similar to the Bullish Harami pattern, which is a bullish reversal pattern that occurs when a large bearish candle is followed by a smaller bullish candle that is "contained" within the range of the previous candle. This pattern suggests that the bears were in control during the first candle, but the bulls may be starting to take control during the second candle.
As with any technical analysis, it's important to consider the Bearish Harami pattern in the context of the overall trend and in conjunction with other indicators, before making any trades.
Reversal patterns:
Doji
The Doji is a neutral pattern that indicates indecision or a potential change in the direction of the current trend. It is characterized by a small real body (either black or white) with the open and closed prices being at the same or very close to the same level. The long upper and lower shadows suggest that both bulls and bears were active during the trading period, but neither was able to gain control, resulting in the indecision represented by the Doji.
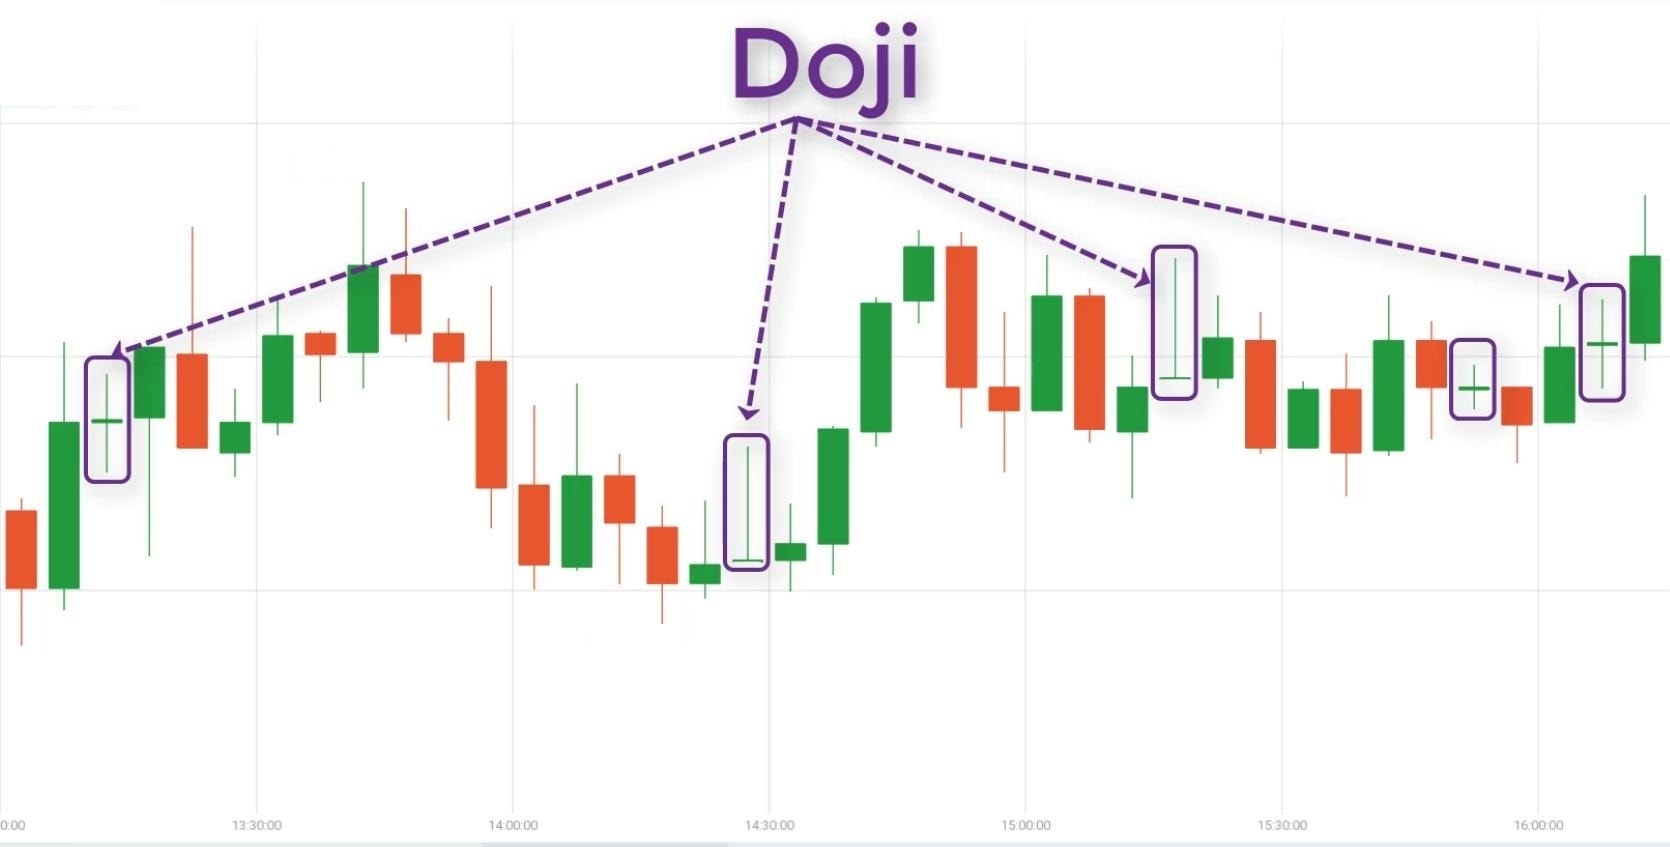
A Doji on its own may not be a strong signal, but when it appears after a long trend or at key levels of support or resistance, it can indicate a potential reversal. Also, if it's followed by a candle of the opposite colour, it can be a stronger signal of a trend change.
It's worth noting that there are different types of Doji patterns such as Dragonfly Doji, Gravestone Doji, and Long-legged Doji. Each of them has a slightly different meaning and implications.
It's important to consider the Doji pattern in the context of the overall trend and in conjunction with other indicators, before making any trades.
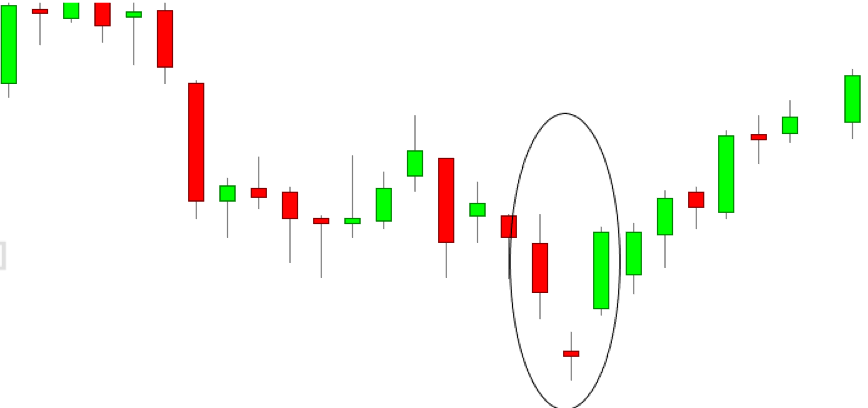
Morning Star
The Morning Star pattern is a bullish reversal pattern that occurs at the bottom of a downtrend. It is a three-candle pattern, consisting of a long bearish candle, a small bullish or bearish candle, and a long bullish candle. The small candle represents a period of indecision and the long bullish candle confirms the reversal of the trend.
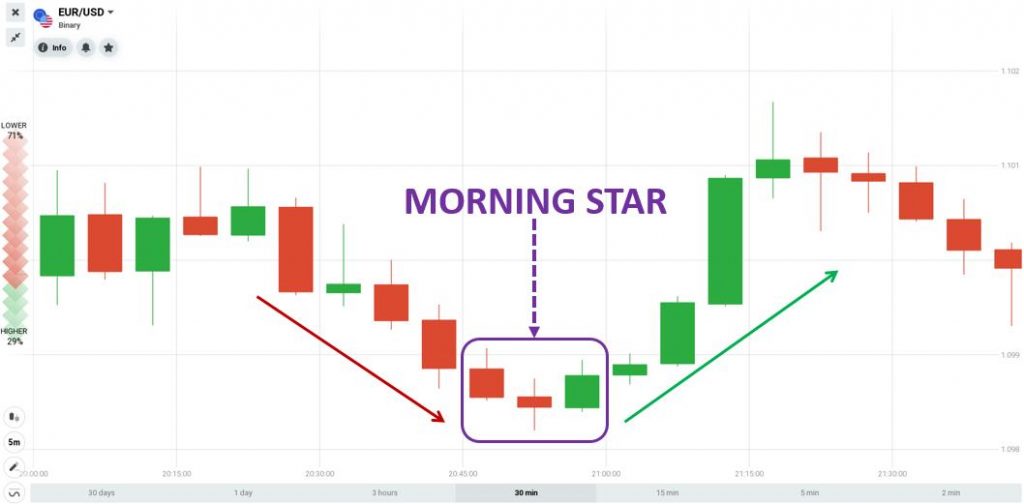
The Morning Star pattern is considered a strong signal that the bears have lost control and the bulls are taking over, and it's a good indication that the price will continue to rise. It's more significant if it appears after a significant downtrend, and it's more reliable if it's followed by an increase in volume.
It's worth noting that the Morning Star pattern is similar to the Evening Star pattern, which is a bearish reversal pattern that occurs at the top of an uptrend. The Evening Star pattern is a three-candle pattern, consisting of a long bullish candle, a small bearish or bullish candle, and a long bearish candle.
As with any technical analysis, it's important to consider the Morning Star pattern in the context of the overall trend and in conjunction with other indicators, before making any trades.
Evening Star
The Evening Star pattern is a bearish reversal pattern that occurs at the top of an uptrend. It is a three-candle pattern, consisting of a long bullish candle, a small bearish or bullish candle, and a long bearish candle. The small candle represents a period of indecision and the long bearish candle confirms the reversal of the trend.
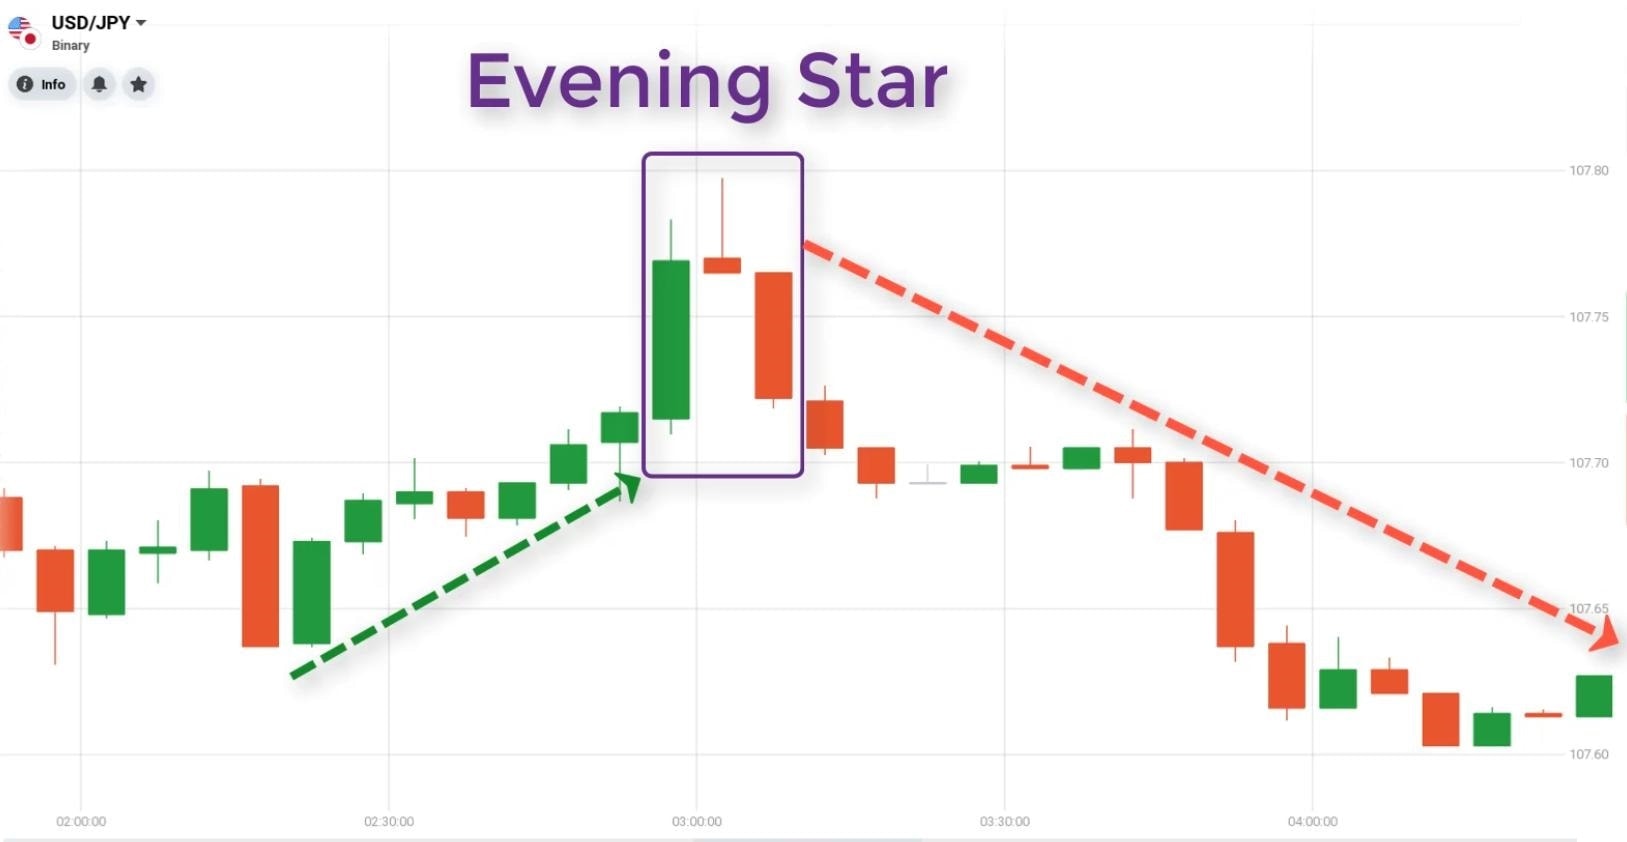
The Evening Star pattern is considered a strong signal that the bulls have lost control and the bears are taking over, and it's a good indication that the price will continue to decrease. It's more significant if it appears after a significant uptrend, and it's more reliable if it's followed by an increase in volume.
It's worth noting that the Evening Star pattern is similar to the Morning Star pattern, which is a bullish reversal pattern that occurs at the bottom of a downtrend. The Morning Star pattern is a three-candle pattern, consisting of a long bearish candle, a small bullish or bearish candle, and a long bullish candle.
As with any technical analysis, it's important to consider the Evening Star pattern in the context of the overall trend and in conjunction with other indicators, before making any trades.
Abandoned Baby
The Abandoned Baby pattern is a bearish reversal pattern that occurs after an uptrend. It is a three-candle pattern, consisting of a long bullish candle, a doji candle that gaps away from the previous candle, and a long bearish candle. The Doji candle represents a period of indecision and the long bearish candle confirms the reversal of the trend.
The Abandoned Baby pattern is considered a strong signal that the bulls have lost control and the bears are taking over, and it's a good indication that the price will continue to decrease. It's more significant if it appears after a significant uptrend, and it's more reliable if it's followed by an increase in volume.
It's worth noting that the Abandoned Baby pattern is a rare pattern and it's important to consider the context of the market and other indicators before making any trades based on this pattern.
As with any technical analysis, it's important to consider the Abandoned Baby pattern in the context of the overall trend and in conjunction with other indicators, before making any trades.
It's worth noting that some patterns are considered stronger signals than others, and the significance of a pattern may also depend on the context in which it appears (e.g. whether it appears after an uptrend or a downtrend).
You can check our Stock technical analysis course.